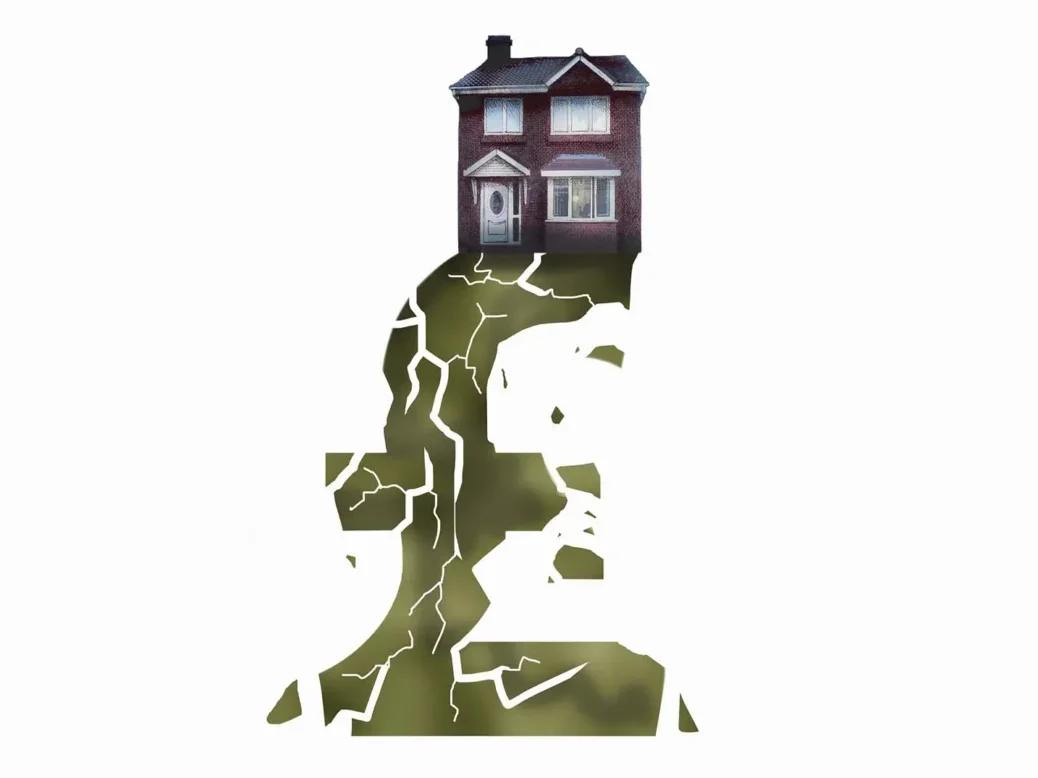
In the Britain of 2021, who earns more: you or your house? In normal times it would be you. But the Covid-19 crisis, combined with the restriction in housing supply across the country by successive governments, has meant this might not be the case anymore; for many people this year, their house earned more than they did.
Data from both the Office for National Statistics and HM Land Registry for August 2021 found that UK house prices grew almost 11 per cent over the past 12 months. This is one of the highest monthly rate rises since the 2008 financial crisis. What this means in practice is that the average house gained £25,000 in value for the year 2020-21 – a figure greater than the salaries, both pre and post tax, of millions of Britons.
This does vary across the country, and depends on the type of dwelling you have. Try our widget to find out if your house earned more than you did.
The other caveat is that, in some boroughs, the change in dwelling price has been hidden from view. This is because the data is real-time and dependent on the volume of transactions taken (for example the number of house sales). If there are very few transactions, such as for detached houses in Tower Hamlets, then the data isn’t provided. This makes for a somewhat patchy data set in some places. But for the most part, there is enough data to draw some interesting conclusions.
Generally speaking, houses in the south and east have made more than the working residents living there. In contrast, in places such as Burnley, one of the cheapest places to live, not only in the north-west but in the whole country, locals made more than the dwellings they inhabited.
But the dividing lines are not as tightly aligned to deprivation or north vs south as expected. You might expect dwellings in Ealing, Cambridge and York to make more than the median worker living there – and you would be right. But interestingly, dwellings in high-deprivation areas such as Rotherham and Oldham also made more than the working people living there, accounting for employee earnings after tax.
The gaps between what you make and what your house makes is particularly egregious in places such as Cambridge and Hammersmith and Fulham. In Cambridge, the average employee made just under £32,000 in 2020. The average house, meanwhile, made £51,500. In Hammersmith and Fulham, the average house put on an extra £114,983 of value for 2020-21. The median employee, after tax, made just £31,720.
Further afield from London, in Stratford-upon-Avon, the average house price rose by £62,335. At the same time, the median worker made just £26,341 after tax.
There are some places that buck the trend. Head to Manchester proper and we find the median employee in 2020 made £23,184 after tax, but the price of a local dwelling there rose by just £10,991. And in Barrow-in-Furness, the median employee earned £27,556, while the local dwelling saw a house price increase of just £17,515.
But in general, while British workers may have been struggling during the pandemic, the average British house has done just fine.