Voters behave differently midway through a parliament. That feels like a statement of the obvious but it’s quite an important one. Peter Kellner, the former YouGov president, drew attention to it in a fascinating blog post on 24 May.
Chunks of a government’s support base tend to become apathetic or indifferent a few years into a new parliamentary term before returning in time for the general election. In practice, this magnifies the opposition’s poll leads and can push down the incumbent party’s vote share at by-elections. But, as Kellner points out, this pattern of exacerbation is not replicated at a general election.
Historically, uniform swing – parties losing about as many points in safe seats as in marginals – rather than proportionate swing has shaped general elections. But at present, forecasters and pollsters – Britain Predicts included – show a proportionate swing: larger swings in safe seats. In some instances, this is a product of the model design. In others, it reflects the midterm polling positions. To understand what I’m talking about, see this.
Related


If a party is projected to lose support, this is likely to be exacerbated in safe seats. This is what the forecasters are saying right now. At the time of writing, my Britain Elects poll tracker has the Conservatives on course to fall from 44 per cent of the vote in 2019 to 28 per cent if an election was held today, a fall of 16 percentage points nationally. In seats where the Conservatives won more than 70 per cent of the vote at the last election, however, we project their share will fall by an average of 27 points.
It's stark. This is proportionate swing and in past general elections it hasn’t always prevailed. Kellner cites this fact as a warning to pollsters and modellers that they could be exaggerating the scale of future Conservative losses. Unless there really has been “a fundamental shift in the nature of swing at general elections”, he writes, “David Butler’s theory of uniform swing will emerge from its mid-term hibernation and come back to life”.
I agree that uniform swing isn’t dead, but following a holiday of thinking and consulting my data, my tentative conclusion is that it won’t be as relevant at the next election as normally.
As to whether my model is overstating the scale of Conservative losses, I am not confident it is. There are few Conservative seats with massive majorities at the last election that we presently forecast the party will lose. We may say their votes are falling furthest there, absolutely, but enough to shift seats? Not right now. If we were to change the methodology to one of uniform swing, then the scale of the Conservative losses presently forecast would be reduced by a dozen, if that.
But I don't think that's necessary, because of the evidence of the local elections. Votes cast in local elections don’t often result in wild, proportionate, swings. The May 2023 local elections just gone, however, were an exception.
[See also: Why has Labour’s poll lead shrunk?]
Source(s): Andrew Teale and Britain Elects
This visualisation charts the performance of the governing parties in local elections and how their support has shifted since the last time the seats contested were up for grabs. Each dot represents a ward. The horizontal axis plots how pro-Conservative or pro-Labour those wards were in a certain year, and the vertical axis plots how that ward shifted in the relevant local election. For the visual learners, a perfectly proportionate swing would be the wards lining up from the top left to the bottom right, and perfectly uniform would be them lining up in a horizontal line.
In the 2008 local elections the shift in support for Labour wasn’t entirely uniform, but nor was it proportionate. And this was a year when the party was in a state of free-fall. In 2012 the correlation between support size and support fall was weak (an R squared value of 0.15) but worthy of note – compared with 2008 the Tory share was down nine points, Labour's up 11. In 2014 (not featured) and 2019 (featured) the correlation was non-existent. But in 2023 it’s at its most obvious (R squared value of 0.30, double the correlation score of 2012). The greater the level of support for the Conservatives in 2019, the more it collapsed in 2023. By no stretch is it a perfect correlation, but it is the most clear trend we have seen in a local election in recent history.
We don't usually see relatively proportionate swings in a local election in which thousands of council seats are contested. While a local election reflects midterm parliamentary events and midterm voters, it is curious that over the last ten to 15 years, not just those featured in the visualisation above, we have never seen a swing quite so proportionate as the one in May 2023.
Whatever it will ultimately mean, this is not normal. Parliamentary by-elections may swing proportionately, but local elections generally don’t.
My contention is that uniform swing is not as prominent as it used to be. And while deference to history is understandable in arguing it will return, as midterm voters might (as I have written before), it is misguided when we are in an ahistorical position. It would be unprecedented for the Conservatives to achieve a fifth consecutive election victory and unprecedented – in post-war history, at least – for Labour to return to office from a base as low as 2019. But the last time an opposition party wasn’t simply leading the government in the polls – as Ed Miliband’s Labour did – but was also leading on economic competence (as Labour is right now), the government of the day changed colour.
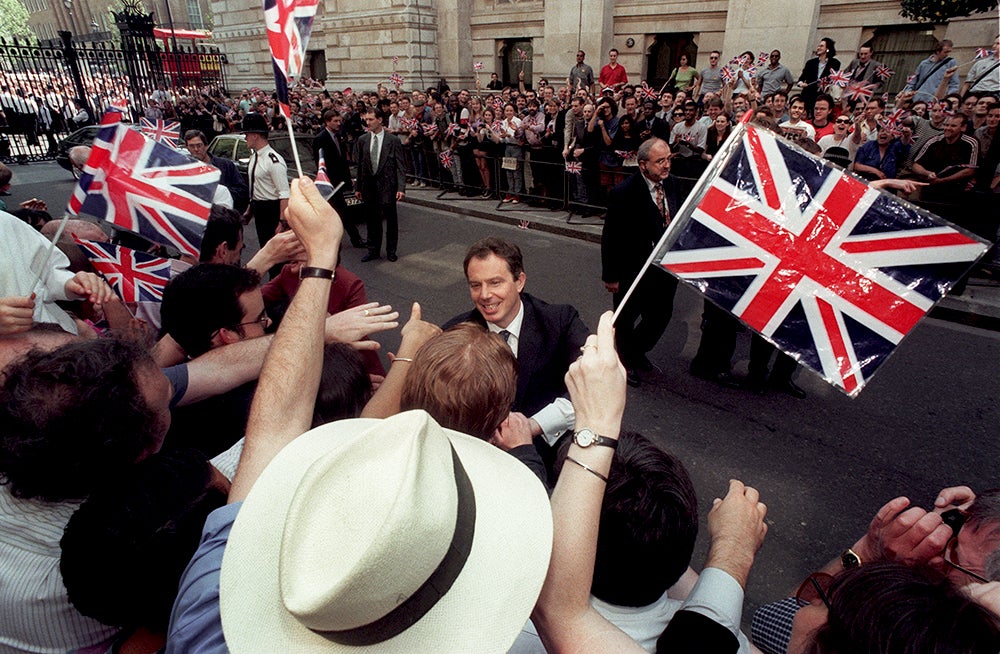
Tony Blair’s 1997 landslide was achieved not just because his party was ahead on voting intention (Neil Kinnock managed that in 1990-92), but also because Labour was most trusted to manage the economy – in my view the most crucial polling metric. And Blair also won because he led John Major on both likeability and public trust – metrics that Kinnock, Michael Howard, Gordon Brown, Miliband and Jeremy Corbyn rarely, if ever, came close to leading on. While the scales of the margins are markedly smaller now, the same can be said of Keir Starmer’s advantage over Rishi Sunak and Labour’s economic advantage over the Tories – however unlikely this may seem to the permanently online.
It is because of this and a litany of other data I have written on elsewhere that I am confident we are heading for a “change election” in 2024 or 2025. Change elections aren’t entirely proportionate, but the scale of decline for the government, plus the local election results of this May, would put us closer to 1997 than to 2010; 1997 wasn't wholly proportionate, but nor was it uniform.
This piece is a critical response to the assumption that uniform swing will reassert itself with force at the next election. I am not sure it will, and the trend in local election results over the last two decades suggests that when it comes to elections with large swings, we are becoming less and less uniform. I do not know to what extent, but I do know this: the British voter is on manoeuvres – enthusiasm for the Conservative brand is the reserve of just 20 per cent of the country. This is not normal.
[See also: Who would win if a general election was held today?]